Course Performance Analysis - Prometheus
Mar 07, 2021

Q1. Trend Risk Protection( SPY & Stocks) Performance Analysis
Q2. Improved Index Trend (SPY) Performance Analysis
Q3. Counter Punch (SPY) Performance Analysis
Q4. Lazy trend Follower (SPY) Performance Analysis
Q5. Face The train (SPY) Performance Analysis
Q6. Ride the aggression (Stocks)
Q8. Stable mean revert (Stocks)
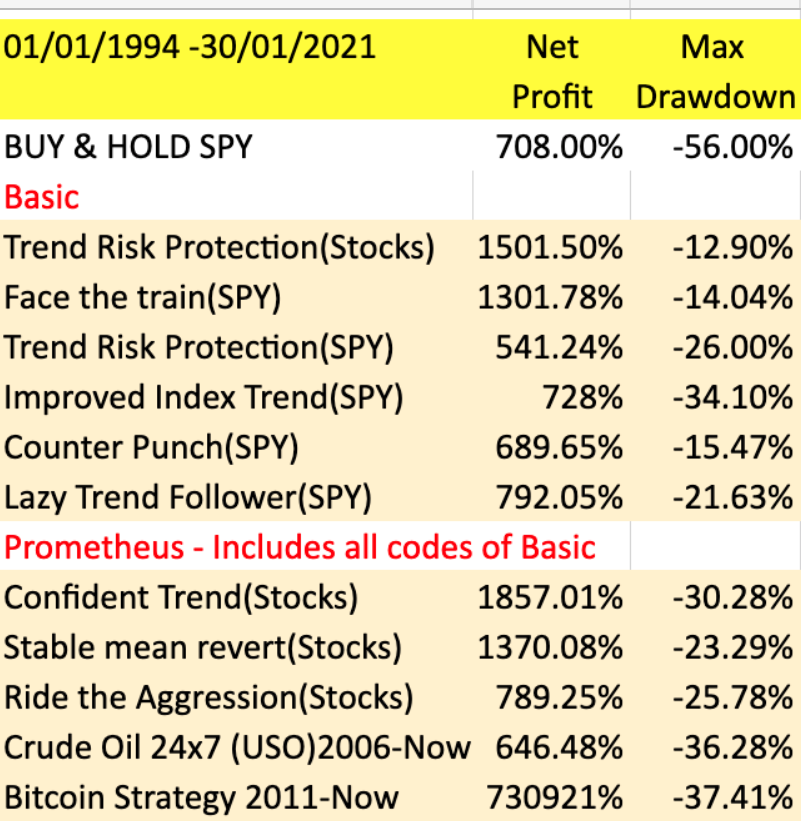
- We have 9 successful systems we discuss in our courses. All these systems have beaten the SPY either by drawdowns or returns.
- We discuss both in index funds and a portfolio of stocks.
- There is 5 systems in the basic course and an additional 4 systems in Prometheus package.
- We also discuss how to diversify efficiently the systems along with pairs trading in Prometheus+ package.
- Optimization and walk forward analysis has been discussed one for Trend following system and another for mean reversion system. Once you learn this you can apply this to your strategy to improve your result
- We also discuss other nuances in choosing the right stocks based on the strategy, ie whether it's a trend following or mean reversion system.
- The secret sauce in any trading strategy is not really in the strategy but in solid risk management. Risk reward ratio is heavily taught online, but barely do people discuss position sizing. Success of our systems in stocks rely not just in the strategy but implementing things like position sizing, liquidity and other factors.
- We also discuss other difficulties that could happen during backtest like issues with data and delisted securities and how to overcome this problem.
- Unlike other systems seen online, 4 Monte Carlo tests are also performed in our Prometheus package so we can really go deeper into our strategy, apply some randomness and see how efficient our strategy is.
- The results of each system is below, There is also links below for individual result of our systems where we provide year by year and month by month performance for past 27 years along with equity curve and drawdown curves
- Most courses don't really backtest which questions its authenticity of success. Some courses who do backtest create bias by either picking individual stocks thats fits the strategy or and conveniently avoids black swan events. We include 3 black swan events(dot com bubble, financial crisis, pandemic) in all our systems to understand how it performs during these times.
- The result below is from high quality paid data feed from Norgate Data applied to Amibroker. The final result might vary based on the platform you use. Tradingview along with other free data are generally unreliable and also uses rounded numbers which varies the final result.
Please be aware that strategies which have worked well in the past may not continue working forever. I CANNOT guarantee the FUTURE performance of the strategies I am demonstrating in this course and you should trade them at your own risk.

